*/

The eighth edition of the Ogden Tables was published in July 2020. This latest edition does not make any fundamental changes to the principles by which future losses are calculated, but there are many changes in emphasis, and because of changes in life expectation the multipliers have also changed – in many cases significantly – since the seventh edition.
This article is designed as a guide through the calculations that are most frequently met in practice. In addition to Ogden calculations, it also contains a guide to claims for the cost of future accommodation, following the Court of Appeal’s decision in Swift v Carpenter [2020] EWCA Civ 1295.
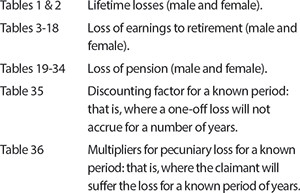
The Tables are available online, and they are also published in the Professional Negligence Bar Association’s (PNBA’s) annual publication Facts & Figures. The Tables cover the following:
You will see that each Table comprises 13 columns, headed from –2.0% to +3.0%. These columns represent different discount rates. The discount rate is an assumed rate of return on claimants’ damages, on the basis of which their income will keep up with inflation, and enable them to replace lost earnings, or buy aids and appliances, or provide accommodation, for as long as they will suffer their losses. When using the Ogden Tables in England and Wales, we use the column headed –0.25%, that being the rate set by the Lord Chancellor in July 2019.
Ogden Tables 1 and 2 deal with losses for life. Table 1 is for men, and Table 2 is for women.
To start with the simplest example, let us take the case of a woman aged 55 who will need to buy batteries for a hearing aid for the rest of her life. These batteries will cost her £50 a year. Her life expectation is normal.
According to Ogden Table 2, using the –0.25% column, the multiplier for life for a 55-year-old woman is 33.53.
So her claim is for [33.53 × £50] = £1,677.
Here, the same claimant suffers from a medical condition which will reduce her life expectation by four years.
She is now 55. If we add four years to her present life expectation, and treat her as a 59-year-old, Ogden Table 2 will give us a lifetime multiplier of 29.25.
So her claim is for [29.25 × £50] = £1,463.
Here, the medical evidence is that the same female claimant suffers from a condition that has reduced her life expectation to 12 years. In such a case, where the doctors have agreed an actual life expectation for the claimant, do not use Tables 1 or 2, because these are based on general life expectations.
Use Table 36; this is the table to use when calculating losses over a known period.
Table 36 gives a multiplier of 12.18 for a 12-year period of loss, so the claim is now [12.18 × £50] = £609.
To find a claimant’s life expectation, where there is no reason to think it might be shorter than the average, use Ogden Table 1 for men, and Table 2 for women. The figure that you see in the 0% column is the life expectation. So:
There are 16 Ogden Tables for use in calculating future loss of earnings: Tables 3-14. These are for calculating loss of earnings to men’s and women’s retirement ages of 50, 55, 60, 65, 68, 70, 75 and 80. (If your claimant is going to retire at 66, 67 or 69 you can find the appropriate multiplier by interpolation: introductory paras 21-24 of the Tables tell you how to do this. Alternatively, you will find these in Table A2 of the PNBA’s Facts & Figures – Tables for the Calculation of Damages.)
To calculate future loss of earnings you will need to know the following about the claimant:
‘Disabled’, ‘employed’ and ‘not employed’, and the various levels of educational attainment, are defined in paras 68-70 of the Introductory Notes to the Tables. The first seven factors give an indication of how much time the claimant would have spent in work if he had not been injured. If someone is currently in work, for example, he is likely on average to spend more of his future working years in work; if someone has a degree, he is likely to spend more time in work than someone with only two GCSEs; the able-bodied tend to spend more time in work than the disabled. These ‘reduction factors’ are brought together in Ogden Tables A-D. For example:
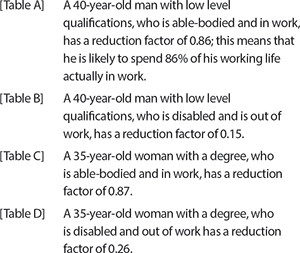
It is important to note that these are only average figures; it may be necessary to adjust them to take into account a claimant’s particular circumstances. Someone who has reached the age of 50 without ever doing a day’s work, for example, is likely to have a reduction factor of 0.00. Loss of three toes might be a disastrous injury for a footballer; it would probably not be so for a dermatologist.
The claimant is female, aged 47, and has no educational qualifications. She was earning £16,750 a year net before the accident, and would have worked to the age of 68. At the time of the accident she was not disabled, but she has been so severely disabled by the accident that she will never work again.
Ogden Table 12 gives us the basic multiplier, which is 18.02.
Then look at Ogden Table C: this gives us an adjustment factor of 0.80.
But for the accident, the claimant would therefore have earned [20.97 × 0.80 × £16,750] = £280,998. As she now has a nil earning capacity, this is her claim.
The claimant is male, aged 38, and has three A-levels but no degree. Before the accident he was able-bodied and he was earning £24,600 net. As a result of his injuries, he is disabled. Currently he is out of work, but when he finds work, he can only expect to earn £8,930 net. He would have worked to 68; he will now have to retire at 65.
The multiplier to age 68 is 29.95 (Ogden Table 11). When he was able-bodied his adjustment factor was 0.89 (Table A). This means that if he had not been injured he would have expected to earn [29.95 × 0.89 × £24,600] = £655,725.
The multiplier to age 65 is 27.05 (Ogden Table 9). Now that he is disabled, the adjustment factor (Table B) is 0.25. His residual earning capacity is therefore [27.05 × 0.25 × £8,930] = £60,389.
Subtracting what he will now earn from what he would have earned gives [£655,725 – £60,389] = £595,336, which is his claim for loss of earnings.
The main difficulty in assessing a pension claim is establishing the annual loss, rather than the multipliers. The multipliers are found in Ogden Tables 19-24. It is worth bearing in mind that there is a relationship between a claimant’s pension and her earnings; when applying the adjustment factors of Tables A-D to the earnings figures, it may also be appropriate to take them into account when calculating future pension as well. After all, if a claimant had only been expected to spend, say, 82% of her future working life in work, that would presumably have affected her level of pension. Before calculating the pension loss for a person already in a pension scheme, ask the pension trustees for an estimate of the pension that she would have received if she had stayed in the scheme until retirement, and what she could now expect to receive if she and her employer were to stop making any more contributions.
Ogden Table 35 is used in the case where, for example, a claimant (of any age) will need a hip replacement costing £17,850 in 17 years’ time, or will need to buy a new car for £16,350 in ten years’ time, and another one ten years after that.
For the hip replacement, Table 35 gives a factor of 1.0435. So the claim is for [1.0435 × £17,850] = £18,626.
For the cars, the adjustment factor for the first car (in 10 years) is 1.0253, and for the second (in 20 years) is 1.0513. Add the two figures, to get 2.0766. The value of the claim is [2.0766 × £16,350] = £33,952.
If you have a claim with a large number of one-off payments (for example, a 30-year-old claimant who will need a new hearing aid costing £1,530 every three years for the rest of his life, there are two approaches. For a quick fix, you could say that £1,530 every three years is £510 a year, and apply a multiplier from Ogden Table 1: [59.75 × £510] = £30,473.
Another approach is to use the handy Table A5 in Facts & Figures. Using the 0% column in Ogden Table 1, you find that the claimant’s life expectation is 55.46 years. Facts & Figures Table A4 gives a multiplier of 19.36 for a loss every three years over a period of 55.46 years. Remember that Table A4 assumes that the first loss will occur in three years’ time, so if the claimant needs the first hearing aid right now, you should add +1 to that figure. The loss is therefore [20.36 × £1,530] = £31,151. This is not too different from the ‘quick fix’ figure, but it is more accurate, and if the sums involved are larger, I would go for accuracy over speed.
Facts & Figures Table A5 saves a great deal of time when one is faced with a claim for numerous aids and appliances, which will need replacement at different intervals. For example:
Let us say that this claimant will live for another 22 years. She will buy:
Year 1 is straightforward in each case: it is the full cost. But you then have another nine calculations to do, which is what Table A5 is designed for.
The claimant will need a hip replacement in seven years’ time (known as ‘a term certain’). Until then, however, he will need care costing £8,555 a year.
Ogden Table 36 tells us that the multiplier for a ‘term certain’ of seven years is 7.06.
The claim for care is therefore [7.06 × £8,555] = £60,398.
Suppose, for example, that when the claimant is 75 she is going to need care that costs £18,429 a year for the rest of her life. She is now only 50 years old, so this head of loss will start to run in 25 years’ time.
Ogden Table 2 tells you that the lifetime multiplier for a woman aged 75 is 14.07.
She is now aged 50, so this period of loss will start in 25 years’ time. Ogden Table 35 gives us a factor of 1.0646 for a loss that will start in 25 years’ time (see example above of one-off loss that will not be incurred immediately).
Her claim for care is therefore [14.07 × 1.0646 × £18,429] = £276,047.
Table A6 in Facts & Figures contains a ready reckoner for such calculations. For example:
In 2016 the Supreme Court decided in the case of Knauer v Ministry of Justice [2016] UKSC 9 that ‘ … the correct date as at which to assess the multiplier when fixing damages for future loss in claims under the Fatal Accidents Act 1976 should be the date of trial and not the date of death.’
This article concentrates on two simple examples of loss of dependency.
As well as the other Ogden Tables, we now use Tables E and F. Table E helps us to factor in to past losses the chance that the deceased would have died by today’s date in any event. Table F does the same, for future losses. Let us assume that the deceased was a man who left a wife and no children. The dependency is £15,000 a year. We need to know:
Let us assume that the deceased would have died first:
Table E says that the discount factor where a 65-year-old man died three years ago is × 0.98. (That is, there is a 2% chance that the average 65-year-old man will die before the age of 68.)
The past loss of dependency is therefore [3 years × 0.98 × £15,000] = £44,100.
For this calculation we use Ogden Table F. Again, we adjust the multiplier for future losses to take into account the chance that the deceased would have died by the date of trial. This is more important the older the deceased was, and the longer it is since his death.
Say that:
Remember to apply the Table A discount. Suppose that the deceased was a graduate, in work and not disabled: the discount factor is 0.83. Table F gives a factor of × 0.98 for the chance that he would have died in the last six years in any event.
So the loss of financial dependency to retirement age is:
[18.83 × 0.83 × 0.98 × £35,000] = £536,071
On 9 October 2020, the Court of Appeal gave judgment in the case of Swift v Carpenter, a case which decided how to calculate a claimant’s damages where it has been necessary for her to buy accommodation because of her injuries. This case supersedes Roberts v Johnstone.
The principle is that the claimant is entitled to the difference in cost between the house that she would have needed if she had not been injured, and the cost of the house that she now needs. The judgment is a complicated one, and this article can only give an outline of how to value such claims. In a nutshell, a claimant gives credit for the market value of the expected reversionary interest in the additional capital required to purchase a suitable property, in the light of her life expectation. The assumption is that a notional purchaser of the reversionary interest in the new property would seek an annual return of 5% on his investment. To perform this calculation, you will need either an Excel spreadsheet or a scientific calculator.
The steps are:
So, for example:
This article has set out some of the most common calculations that will be needed when assessing future losses. There are more complicated calculations (eg where it is necessary to split the multipliers because there will be different losses at different times); guidance for these is to be found in the introductory notes to the Tables.

Simon Levene is a barrister. He was for 25 years an editor of Facts & Figures: Tables for the Assessment of Damages, and for ten years a member of the Ogden Committee.
The eighth edition of the Ogden Tables was published in July 2020. This latest edition does not make any fundamental changes to the principles by which future losses are calculated, but there are many changes in emphasis, and because of changes in life expectation the multipliers have also changed – in many cases significantly – since the seventh edition.
This article is designed as a guide through the calculations that are most frequently met in practice. In addition to Ogden calculations, it also contains a guide to claims for the cost of future accommodation, following the Court of Appeal’s decision in Swift v Carpenter [2020] EWCA Civ 1295.
The Tables are available online, and they are also published in the Professional Negligence Bar Association’s (PNBA’s) annual publication Facts & Figures. The Tables cover the following:
You will see that each Table comprises 13 columns, headed from –2.0% to +3.0%. These columns represent different discount rates. The discount rate is an assumed rate of return on claimants’ damages, on the basis of which their income will keep up with inflation, and enable them to replace lost earnings, or buy aids and appliances, or provide accommodation, for as long as they will suffer their losses. When using the Ogden Tables in England and Wales, we use the column headed –0.25%, that being the rate set by the Lord Chancellor in July 2019.
Ogden Tables 1 and 2 deal with losses for life. Table 1 is for men, and Table 2 is for women.
To start with the simplest example, let us take the case of a woman aged 55 who will need to buy batteries for a hearing aid for the rest of her life. These batteries will cost her £50 a year. Her life expectation is normal.
According to Ogden Table 2, using the –0.25% column, the multiplier for life for a 55-year-old woman is 33.53.
So her claim is for [33.53 × £50] = £1,677.
Here, the same claimant suffers from a medical condition which will reduce her life expectation by four years.
She is now 55. If we add four years to her present life expectation, and treat her as a 59-year-old, Ogden Table 2 will give us a lifetime multiplier of 29.25.
So her claim is for [29.25 × £50] = £1,463.
Here, the medical evidence is that the same female claimant suffers from a condition that has reduced her life expectation to 12 years. In such a case, where the doctors have agreed an actual life expectation for the claimant, do not use Tables 1 or 2, because these are based on general life expectations.
Use Table 36; this is the table to use when calculating losses over a known period.
Table 36 gives a multiplier of 12.18 for a 12-year period of loss, so the claim is now [12.18 × £50] = £609.
To find a claimant’s life expectation, where there is no reason to think it might be shorter than the average, use Ogden Table 1 for men, and Table 2 for women. The figure that you see in the 0% column is the life expectation. So:
There are 16 Ogden Tables for use in calculating future loss of earnings: Tables 3-14. These are for calculating loss of earnings to men’s and women’s retirement ages of 50, 55, 60, 65, 68, 70, 75 and 80. (If your claimant is going to retire at 66, 67 or 69 you can find the appropriate multiplier by interpolation: introductory paras 21-24 of the Tables tell you how to do this. Alternatively, you will find these in Table A2 of the PNBA’s Facts & Figures – Tables for the Calculation of Damages.)
To calculate future loss of earnings you will need to know the following about the claimant:
‘Disabled’, ‘employed’ and ‘not employed’, and the various levels of educational attainment, are defined in paras 68-70 of the Introductory Notes to the Tables. The first seven factors give an indication of how much time the claimant would have spent in work if he had not been injured. If someone is currently in work, for example, he is likely on average to spend more of his future working years in work; if someone has a degree, he is likely to spend more time in work than someone with only two GCSEs; the able-bodied tend to spend more time in work than the disabled. These ‘reduction factors’ are brought together in Ogden Tables A-D. For example:
It is important to note that these are only average figures; it may be necessary to adjust them to take into account a claimant’s particular circumstances. Someone who has reached the age of 50 without ever doing a day’s work, for example, is likely to have a reduction factor of 0.00. Loss of three toes might be a disastrous injury for a footballer; it would probably not be so for a dermatologist.
The claimant is female, aged 47, and has no educational qualifications. She was earning £16,750 a year net before the accident, and would have worked to the age of 68. At the time of the accident she was not disabled, but she has been so severely disabled by the accident that she will never work again.
Ogden Table 12 gives us the basic multiplier, which is 18.02.
Then look at Ogden Table C: this gives us an adjustment factor of 0.80.
But for the accident, the claimant would therefore have earned [20.97 × 0.80 × £16,750] = £280,998. As she now has a nil earning capacity, this is her claim.
The claimant is male, aged 38, and has three A-levels but no degree. Before the accident he was able-bodied and he was earning £24,600 net. As a result of his injuries, he is disabled. Currently he is out of work, but when he finds work, he can only expect to earn £8,930 net. He would have worked to 68; he will now have to retire at 65.
The multiplier to age 68 is 29.95 (Ogden Table 11). When he was able-bodied his adjustment factor was 0.89 (Table A). This means that if he had not been injured he would have expected to earn [29.95 × 0.89 × £24,600] = £655,725.
The multiplier to age 65 is 27.05 (Ogden Table 9). Now that he is disabled, the adjustment factor (Table B) is 0.25. His residual earning capacity is therefore [27.05 × 0.25 × £8,930] = £60,389.
Subtracting what he will now earn from what he would have earned gives [£655,725 – £60,389] = £595,336, which is his claim for loss of earnings.
The main difficulty in assessing a pension claim is establishing the annual loss, rather than the multipliers. The multipliers are found in Ogden Tables 19-24. It is worth bearing in mind that there is a relationship between a claimant’s pension and her earnings; when applying the adjustment factors of Tables A-D to the earnings figures, it may also be appropriate to take them into account when calculating future pension as well. After all, if a claimant had only been expected to spend, say, 82% of her future working life in work, that would presumably have affected her level of pension. Before calculating the pension loss for a person already in a pension scheme, ask the pension trustees for an estimate of the pension that she would have received if she had stayed in the scheme until retirement, and what she could now expect to receive if she and her employer were to stop making any more contributions.
Ogden Table 35 is used in the case where, for example, a claimant (of any age) will need a hip replacement costing £17,850 in 17 years’ time, or will need to buy a new car for £16,350 in ten years’ time, and another one ten years after that.
For the hip replacement, Table 35 gives a factor of 1.0435. So the claim is for [1.0435 × £17,850] = £18,626.
For the cars, the adjustment factor for the first car (in 10 years) is 1.0253, and for the second (in 20 years) is 1.0513. Add the two figures, to get 2.0766. The value of the claim is [2.0766 × £16,350] = £33,952.
If you have a claim with a large number of one-off payments (for example, a 30-year-old claimant who will need a new hearing aid costing £1,530 every three years for the rest of his life, there are two approaches. For a quick fix, you could say that £1,530 every three years is £510 a year, and apply a multiplier from Ogden Table 1: [59.75 × £510] = £30,473.
Another approach is to use the handy Table A5 in Facts & Figures. Using the 0% column in Ogden Table 1, you find that the claimant’s life expectation is 55.46 years. Facts & Figures Table A4 gives a multiplier of 19.36 for a loss every three years over a period of 55.46 years. Remember that Table A4 assumes that the first loss will occur in three years’ time, so if the claimant needs the first hearing aid right now, you should add +1 to that figure. The loss is therefore [20.36 × £1,530] = £31,151. This is not too different from the ‘quick fix’ figure, but it is more accurate, and if the sums involved are larger, I would go for accuracy over speed.
Facts & Figures Table A5 saves a great deal of time when one is faced with a claim for numerous aids and appliances, which will need replacement at different intervals. For example:
Let us say that this claimant will live for another 22 years. She will buy:
Year 1 is straightforward in each case: it is the full cost. But you then have another nine calculations to do, which is what Table A5 is designed for.
The claimant will need a hip replacement in seven years’ time (known as ‘a term certain’). Until then, however, he will need care costing £8,555 a year.
Ogden Table 36 tells us that the multiplier for a ‘term certain’ of seven years is 7.06.
The claim for care is therefore [7.06 × £8,555] = £60,398.
Suppose, for example, that when the claimant is 75 she is going to need care that costs £18,429 a year for the rest of her life. She is now only 50 years old, so this head of loss will start to run in 25 years’ time.
Ogden Table 2 tells you that the lifetime multiplier for a woman aged 75 is 14.07.
She is now aged 50, so this period of loss will start in 25 years’ time. Ogden Table 35 gives us a factor of 1.0646 for a loss that will start in 25 years’ time (see example above of one-off loss that will not be incurred immediately).
Her claim for care is therefore [14.07 × 1.0646 × £18,429] = £276,047.
Table A6 in Facts & Figures contains a ready reckoner for such calculations. For example:
In 2016 the Supreme Court decided in the case of Knauer v Ministry of Justice [2016] UKSC 9 that ‘ … the correct date as at which to assess the multiplier when fixing damages for future loss in claims under the Fatal Accidents Act 1976 should be the date of trial and not the date of death.’
This article concentrates on two simple examples of loss of dependency.
As well as the other Ogden Tables, we now use Tables E and F. Table E helps us to factor in to past losses the chance that the deceased would have died by today’s date in any event. Table F does the same, for future losses. Let us assume that the deceased was a man who left a wife and no children. The dependency is £15,000 a year. We need to know:
Let us assume that the deceased would have died first:
Table E says that the discount factor where a 65-year-old man died three years ago is × 0.98. (That is, there is a 2% chance that the average 65-year-old man will die before the age of 68.)
The past loss of dependency is therefore [3 years × 0.98 × £15,000] = £44,100.
For this calculation we use Ogden Table F. Again, we adjust the multiplier for future losses to take into account the chance that the deceased would have died by the date of trial. This is more important the older the deceased was, and the longer it is since his death.
Say that:
Remember to apply the Table A discount. Suppose that the deceased was a graduate, in work and not disabled: the discount factor is 0.83. Table F gives a factor of × 0.98 for the chance that he would have died in the last six years in any event.
So the loss of financial dependency to retirement age is:
[18.83 × 0.83 × 0.98 × £35,000] = £536,071
On 9 October 2020, the Court of Appeal gave judgment in the case of Swift v Carpenter, a case which decided how to calculate a claimant’s damages where it has been necessary for her to buy accommodation because of her injuries. This case supersedes Roberts v Johnstone.
The principle is that the claimant is entitled to the difference in cost between the house that she would have needed if she had not been injured, and the cost of the house that she now needs. The judgment is a complicated one, and this article can only give an outline of how to value such claims. In a nutshell, a claimant gives credit for the market value of the expected reversionary interest in the additional capital required to purchase a suitable property, in the light of her life expectation. The assumption is that a notional purchaser of the reversionary interest in the new property would seek an annual return of 5% on his investment. To perform this calculation, you will need either an Excel spreadsheet or a scientific calculator.
The steps are:
So, for example:
This article has set out some of the most common calculations that will be needed when assessing future losses. There are more complicated calculations (eg where it is necessary to split the multipliers because there will be different losses at different times); guidance for these is to be found in the introductory notes to the Tables.


The age of criminal responsibility, extreme weather and conflict resolution – plus, new protocol for reporting bullying at the Bar
By David Green
Mário Barroso, Head of R&D and Method Development at AlphaBiolabs, examines the forensic science underpinning hair drug testing, its evidential scope and limitations, and why it remains the gold standard for evidencing patterns of drug use in family proceedings
Unlocking your aged debt to fund your tax in one easy step. By Philip N Bristow
Clement Cowley, Partner at The Penny Group, discusses the upcoming changes to pensions and Inheritance Tax and the potential impact on your financial future
Save the Children UK is the latest charity to benefit from a £500 donation from AlphaBiolabs via the company’s Giving Back initiative
Barrister apprenticeships – shortly to provide the fourth pathway to the Bar – are an ideal opportunity to support local talent and ‘grow your own’, say Tim Coulson and Dr Jane Dennehy
Solicitor General Ellie Reeves KC MP discusses her decade as a trade union and employment law barrister, the demands of life as a Law Officer and the number one priority shaping her work. Interview by Anthony Inglese CB
A decade of reviews and research has disrupted accepted thinking in the search for causality. Suicides following abuse have overtaken domestic homicides. Is the law keeping up? Professor Susan Edwards KC (Hon) examines recent cases and the obstacles to successful prosecution
Why every major sporting event needs an anti-corruption policy. By Louis Weston
At least not that way, says Richard Paige